
Gender pay gap report
1. Overview
Women’s median hourly pay
18.6% lower
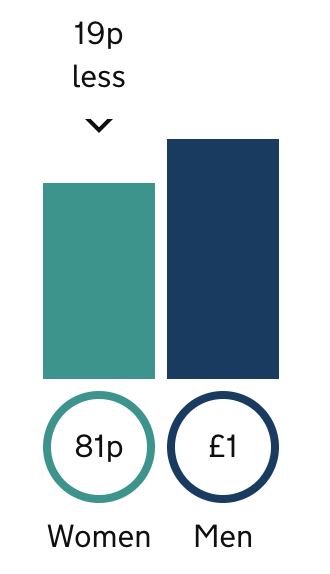
Women earned 81p for every £1 that men earned
Women who received bonus pay
2.9%
compared with 1.6% of men
Women made up
11.5%
of employees in the highest paid quarter
25.8%
of employees in the lowest paid quarter
2. Main gender pay gap figures
In this organisation:
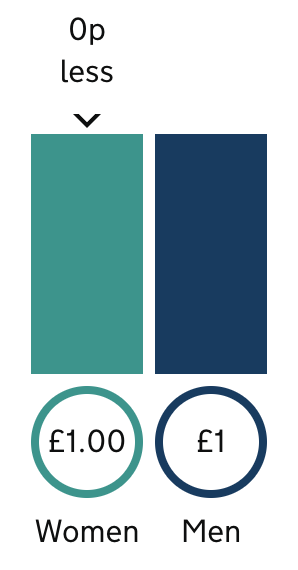
- women’s bonus pay was 0.0% lower than men’s (comparing median bonus pay)
- women earned 81p for every £1 that men earned (comparing median hourly pay)
- women made up 11.5% of employees in the highest paid quarter, and 25.8% of employees in the lowest paid quarter
- 2.9% of women received bonus pay, compared with 1.6% of men
3. Hourly pay
In this organisation:
- women’s median hourly pay was 18.6% lower than men’s – this means they earned 81p for every £1 that men earn when comparing median hourly pay
- women’s mean (average) hourly pay was 16.5% lower than men’s
The median gender pay gap figure
This is the difference between the median hourly pay for men and the median hourly pay for women. The median figure is the hourly pay of the man or woman in the middle of a list, ordered from highest to lowest paid.
If there is an even number of men or women, the median is the mean average of the 2 employees in the middle.
Medians are useful to indicate the ‘typical’ situation. They are not distorted by very high or low hourly values. But they may make some gender pay gap issues harder to identify – for example, if the issues are most among the lowest paid or highest paid employees.
The mean (average) gender pay gap figure
To work out their mean gender pay gap, employers add together the hourly pay of all their male employees and divide that figure by the number of men. They repeat this for women.
Mean averages are useful because they place the same value on every number they use, giving a good overall indication of the gender pay gap. But very high or low hourly pay can ‘dominate’ and distort the figure.
4. Pay quarters
In this organisation, women made up:
- 11.5% of employees in the upper pay quarter (highest paid jobs)
- 24.6% of employees in the upper middle pay quarter
- 49.2% of employees in the lower middle pay quarter
- 25.8% of employees in the lower pay quarter (lowest paid jobs)

| Pay quarter | Women (%) | Men (%) | Total (%) | |
|---|---|---|---|---|
| Upper hourly pay quarter (highest paid) | Percentage in this pay quarter | 11.5 | 88.5 | 100 |
| Percentage of all employees | 2.9 | 22.1 | 25 | |
| Upper middle hourly pay quarter | Percentage in this pay quarter | 24.6 | 75.4 | 100 |
| Percentage of all employees | 6.2 | 18.9 | 25 | |
| Lower middle pay quarter | Percentage in this pay quarter | 49.2 | 50.8 | 100 |
| Percentage of all employees | 12.3 | 12.7 | 25 | |
| Lower hourly pay quarter (lowest paid) | Percentage in this pay quarter | 25.8 | 74.2 | 100 |
| Percentage of all employees | 6.5 | 18.6 | 25 | |
| Totals | 27.8 | 72.2 | 100 |
Pay quarters give an indication of women’s representation at different levels of the organisation.
To make this calculation, employers have to list all their employees from highest to lowest hourly pay. They then divide this list into 4 quarters, and work out the percentage of men and women in each quarter.
5. Bonus pay
In this organisation:
- women’s median bonus pay was 0% lower than men’s – this means they earned £1.00 for every £1 that men earn when comparing median bonus pay
- women’s mean (average) bonus pay was 0% lower than men’s
- 2.9% of women and 1.6% of men received bonus pay
6. About A. CONNOLLY LIMITED
Registered address
The Old Dairy, Leed Street, Wigan, United Kingdom, WN3 4BW
Sector
Construction
Snapshot date
5 April 2024
Employee headcount
250 to 499 employees
Person responsible
Kate Whistance (Finance)